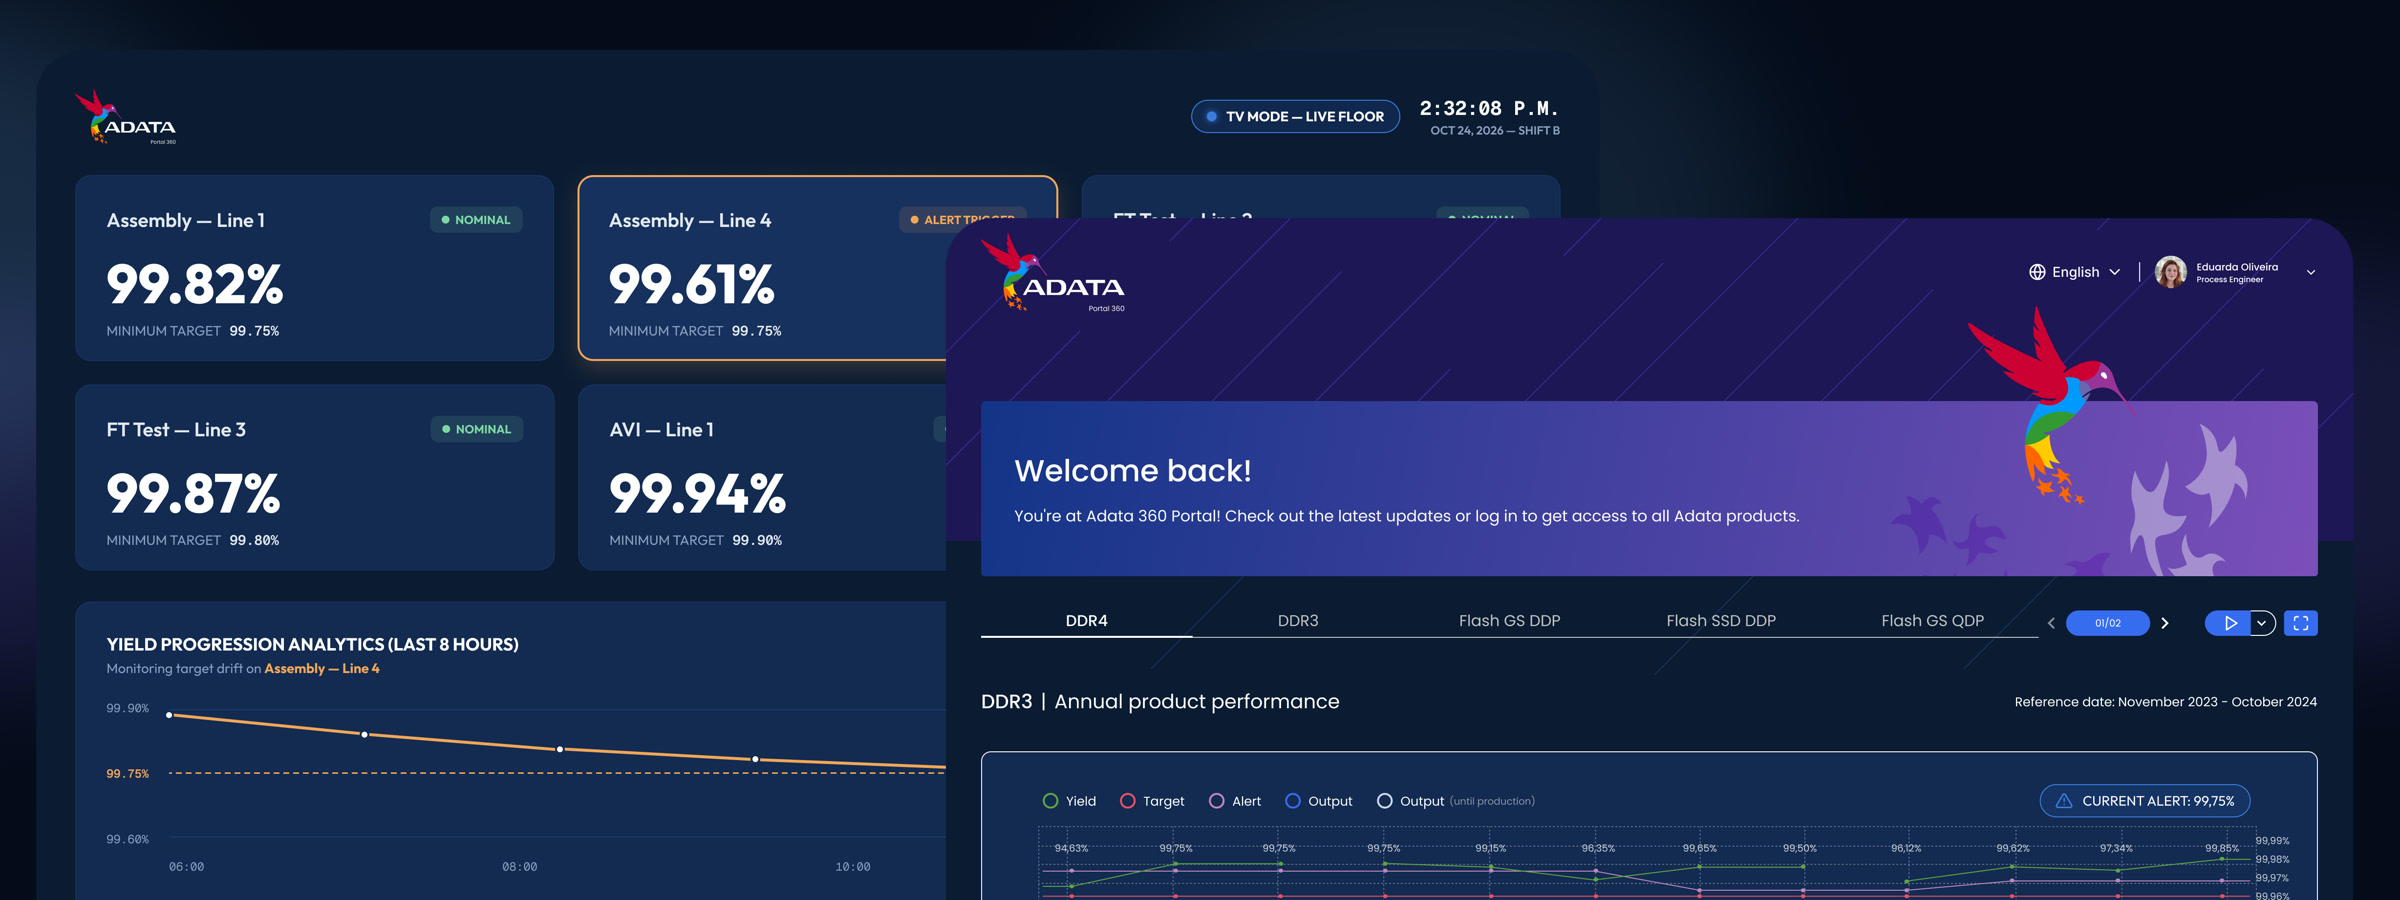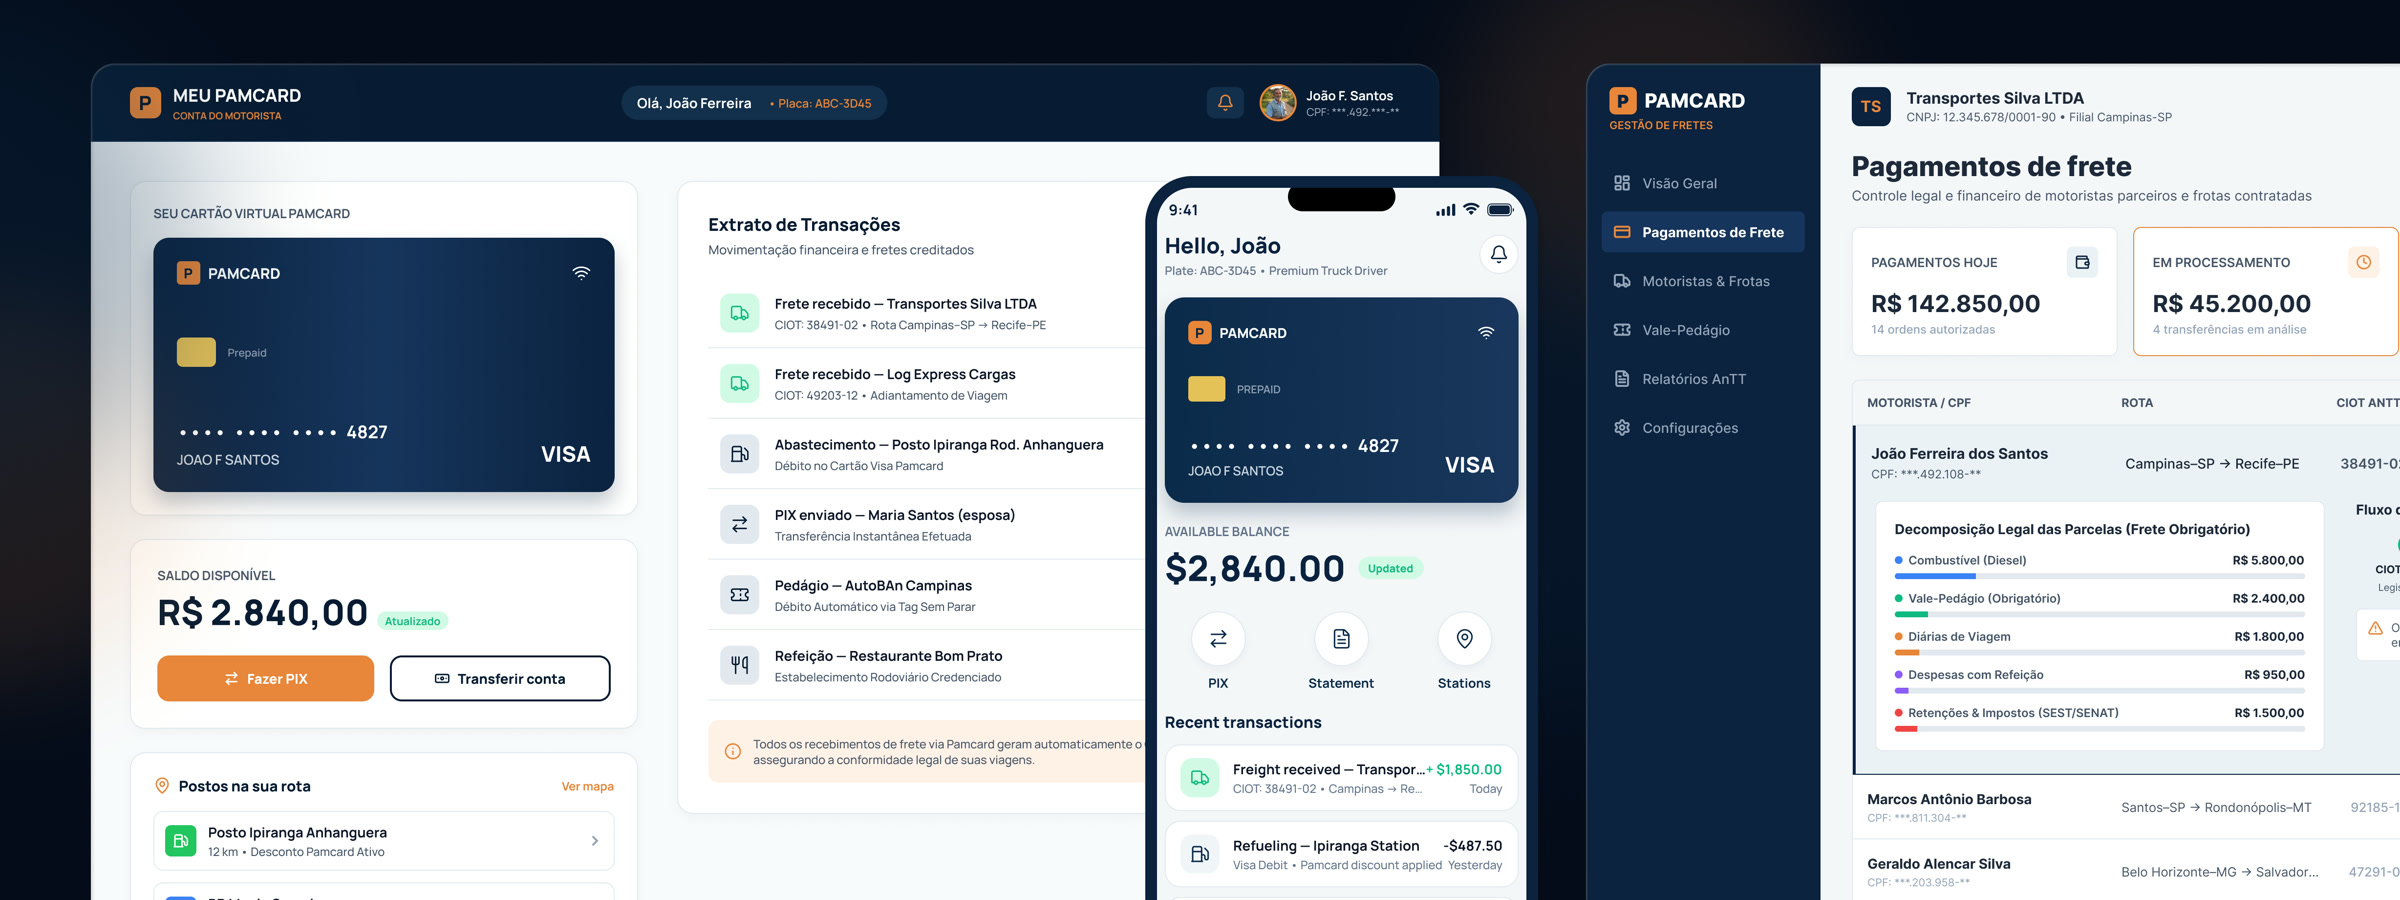
The business
Money flows from holding companies to truck drivers. RoadCard sits in the middle.
RoadCard lets freight companies pay truck drivers across Brazil and earns a share of every transaction. By law, a freight charge can't be paid as a lump sum. It has to be split into labeled parts, like daily rate, fuel, meals and tolls, each paid and traced on its own.
Time matters too. A driver at a loading dock needs the payment confirmed fast.
The brief
Ten years of growth. Then it stopped.
Clients seemed to hit a spending ceiling and stay there. RoadCard's own data showed nothing unusual: no spike in support, no churn pattern. They came to Venturus with one observation and no hypothesis.
Our clients seem to have hit a spending ceiling with us. We don't know why.
RoadCard, the brief
Research
First, learn the world. Then talk to people.
I spent the first weeks on freight regulation, industry vocabulary and how cargo operations run day to day. Without that baseline, I wouldn't recognize the important moment when a user said it.
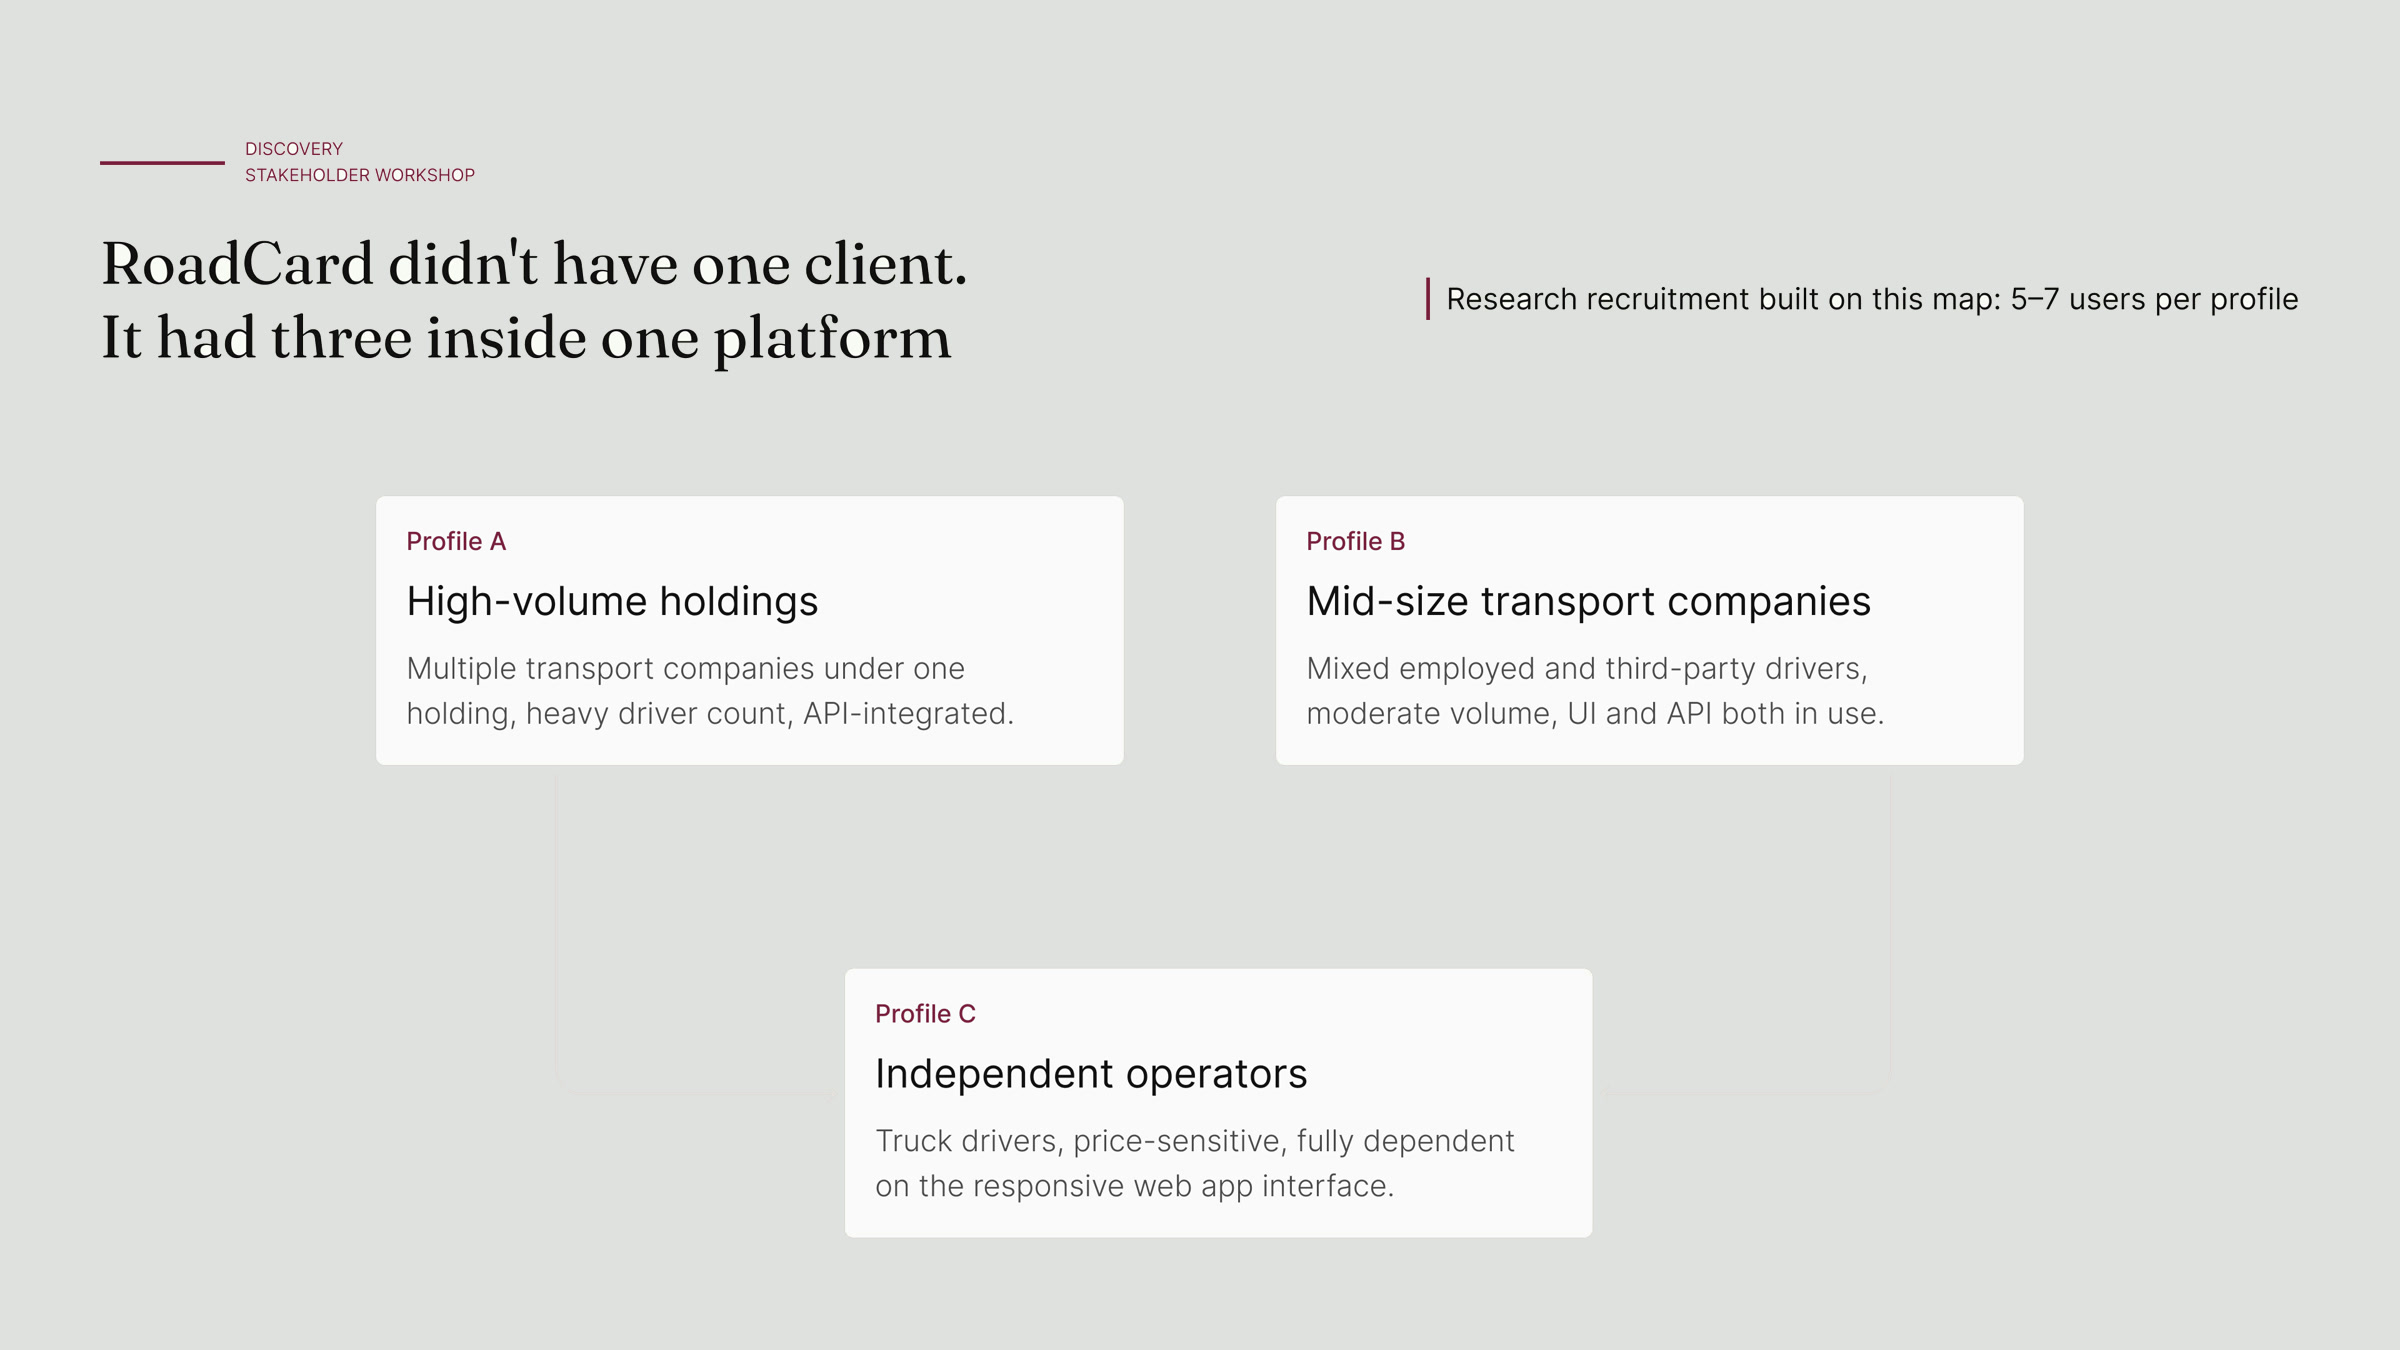
Three internal interviews and a mapping workshop showed the client base wasn't one group. We defined three profiles by client size, product mix and operational complexity, then recruited 5 to 7 users per profile. I expanded the sample as patterns appeared and finished with more than 25 open, semi-structured interviews.
What users said
Two findings came from what users said. The third came from what they did.
01The interface had been quietly abandoned.
Pages broke at common screen sizes, links were dead and content was out of date. Users moved the payment flow to the API, not because the API was better, but to get around one broken flow. They still came back to the platform for everything else, which is why redesigning the interface beat an API first strategy.
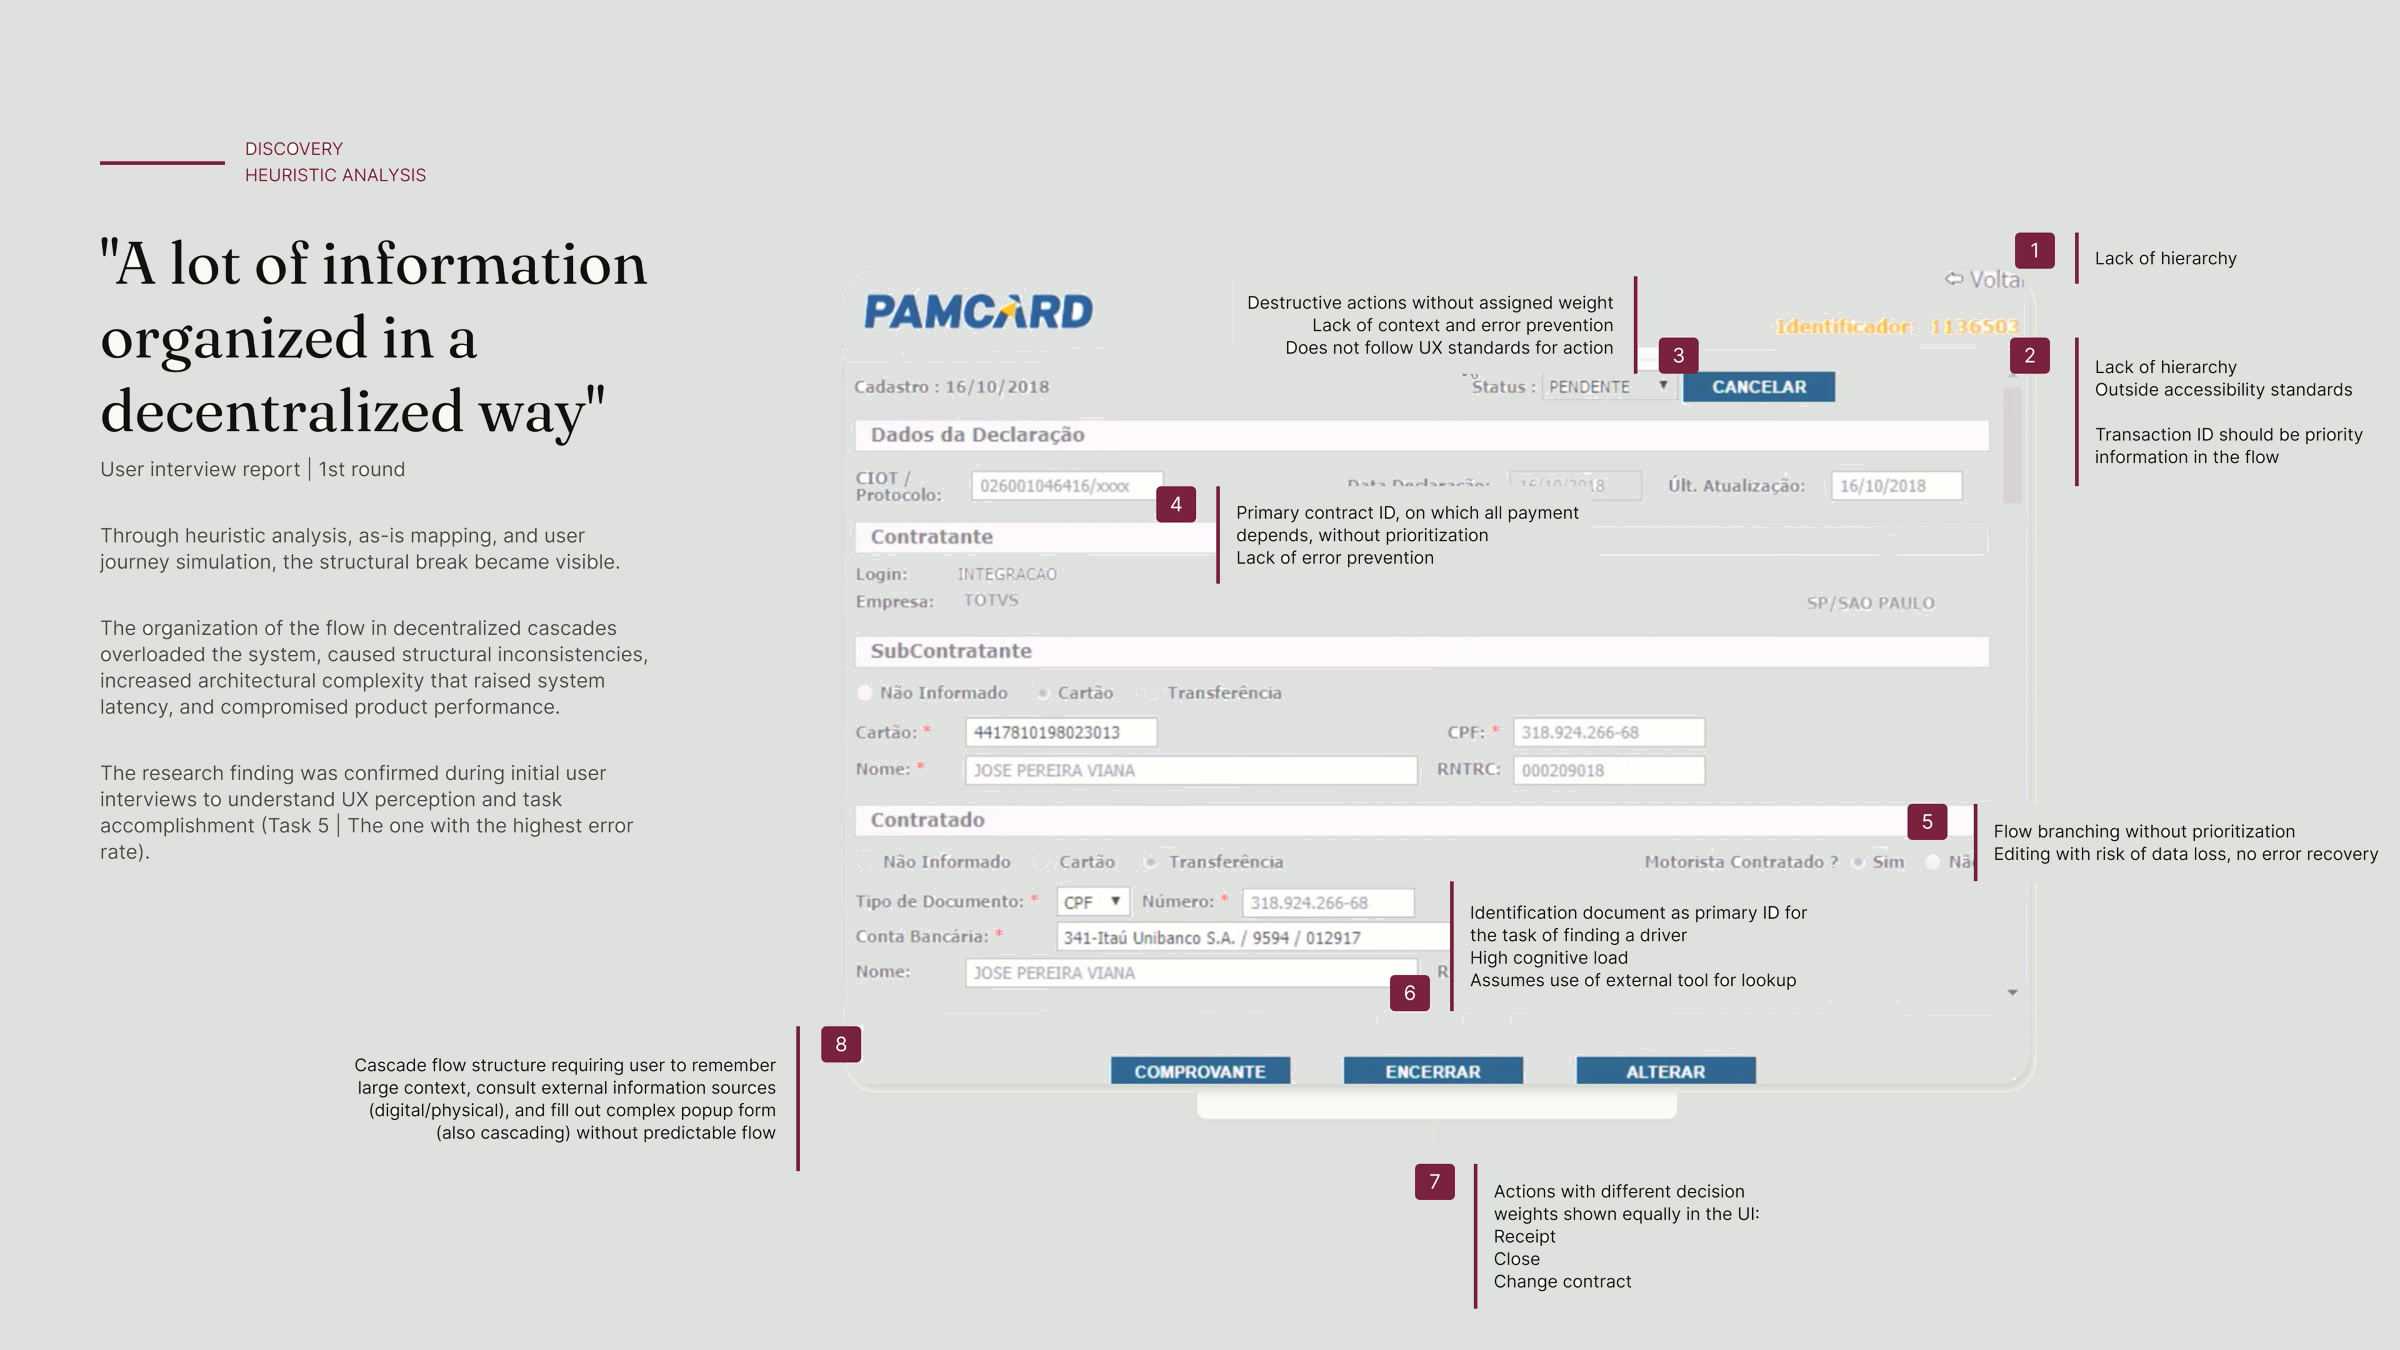
Platform audit of RoadCard's web interface, flagging broken links, rendering errors at common resolutions and outdated content 02Users avoided RoadCard during business hours.
When timing mattered most, the platform was too slow. So users sent daytime payments through competitors, some of them more expensive. The revenue ceiling was simply what was left after competitors took the daytime volume.
Validation
NPS, scored by the same people I interviewed.
Each participant answered an NPS survey after their session, so scores attached to specific moments, not the product as a whole. Overall NPS was -22. Clients who depended on the web interface scored -41, mixed users -22 and large API clients -8.
The lowest scores came from users with the fewest workarounds. Satisfaction wasn't measuring the product. It was measuring how well each client had learned to avoid it.
Two presentations
The first session was not calm. The second changed the company's direction.
I presented the findings to RoadCard's team, including IT and infrastructure for the first time. Nobody in the room knew about the delay, including the people who ran the system. The session was interrupted again and again, and we closed it with an impromptu workshop on first solution directions.
Within a week, the findings needed to reach the CEO. I rebuilt the presentation around business impact, using RoadCard's own transaction and revenue data. The model was deliberately conservative: recover 15 to 25% of the displaced daytime volume within 12 to 18 months of the fix, with no new clients. That meant 9 to 16% more revenue from the researched client base.
With the freight market growing about 5% a year, a flat line wasn't a market ceiling. It was share moving to competitors, one afternoon at a time. RoadCard hasn't shared post-fix revenue, so the projection stays a projection. The diagnosis and the decisions it led to are confirmed.
Solution design
Audit, benchmark, then a structure built on real behavior.
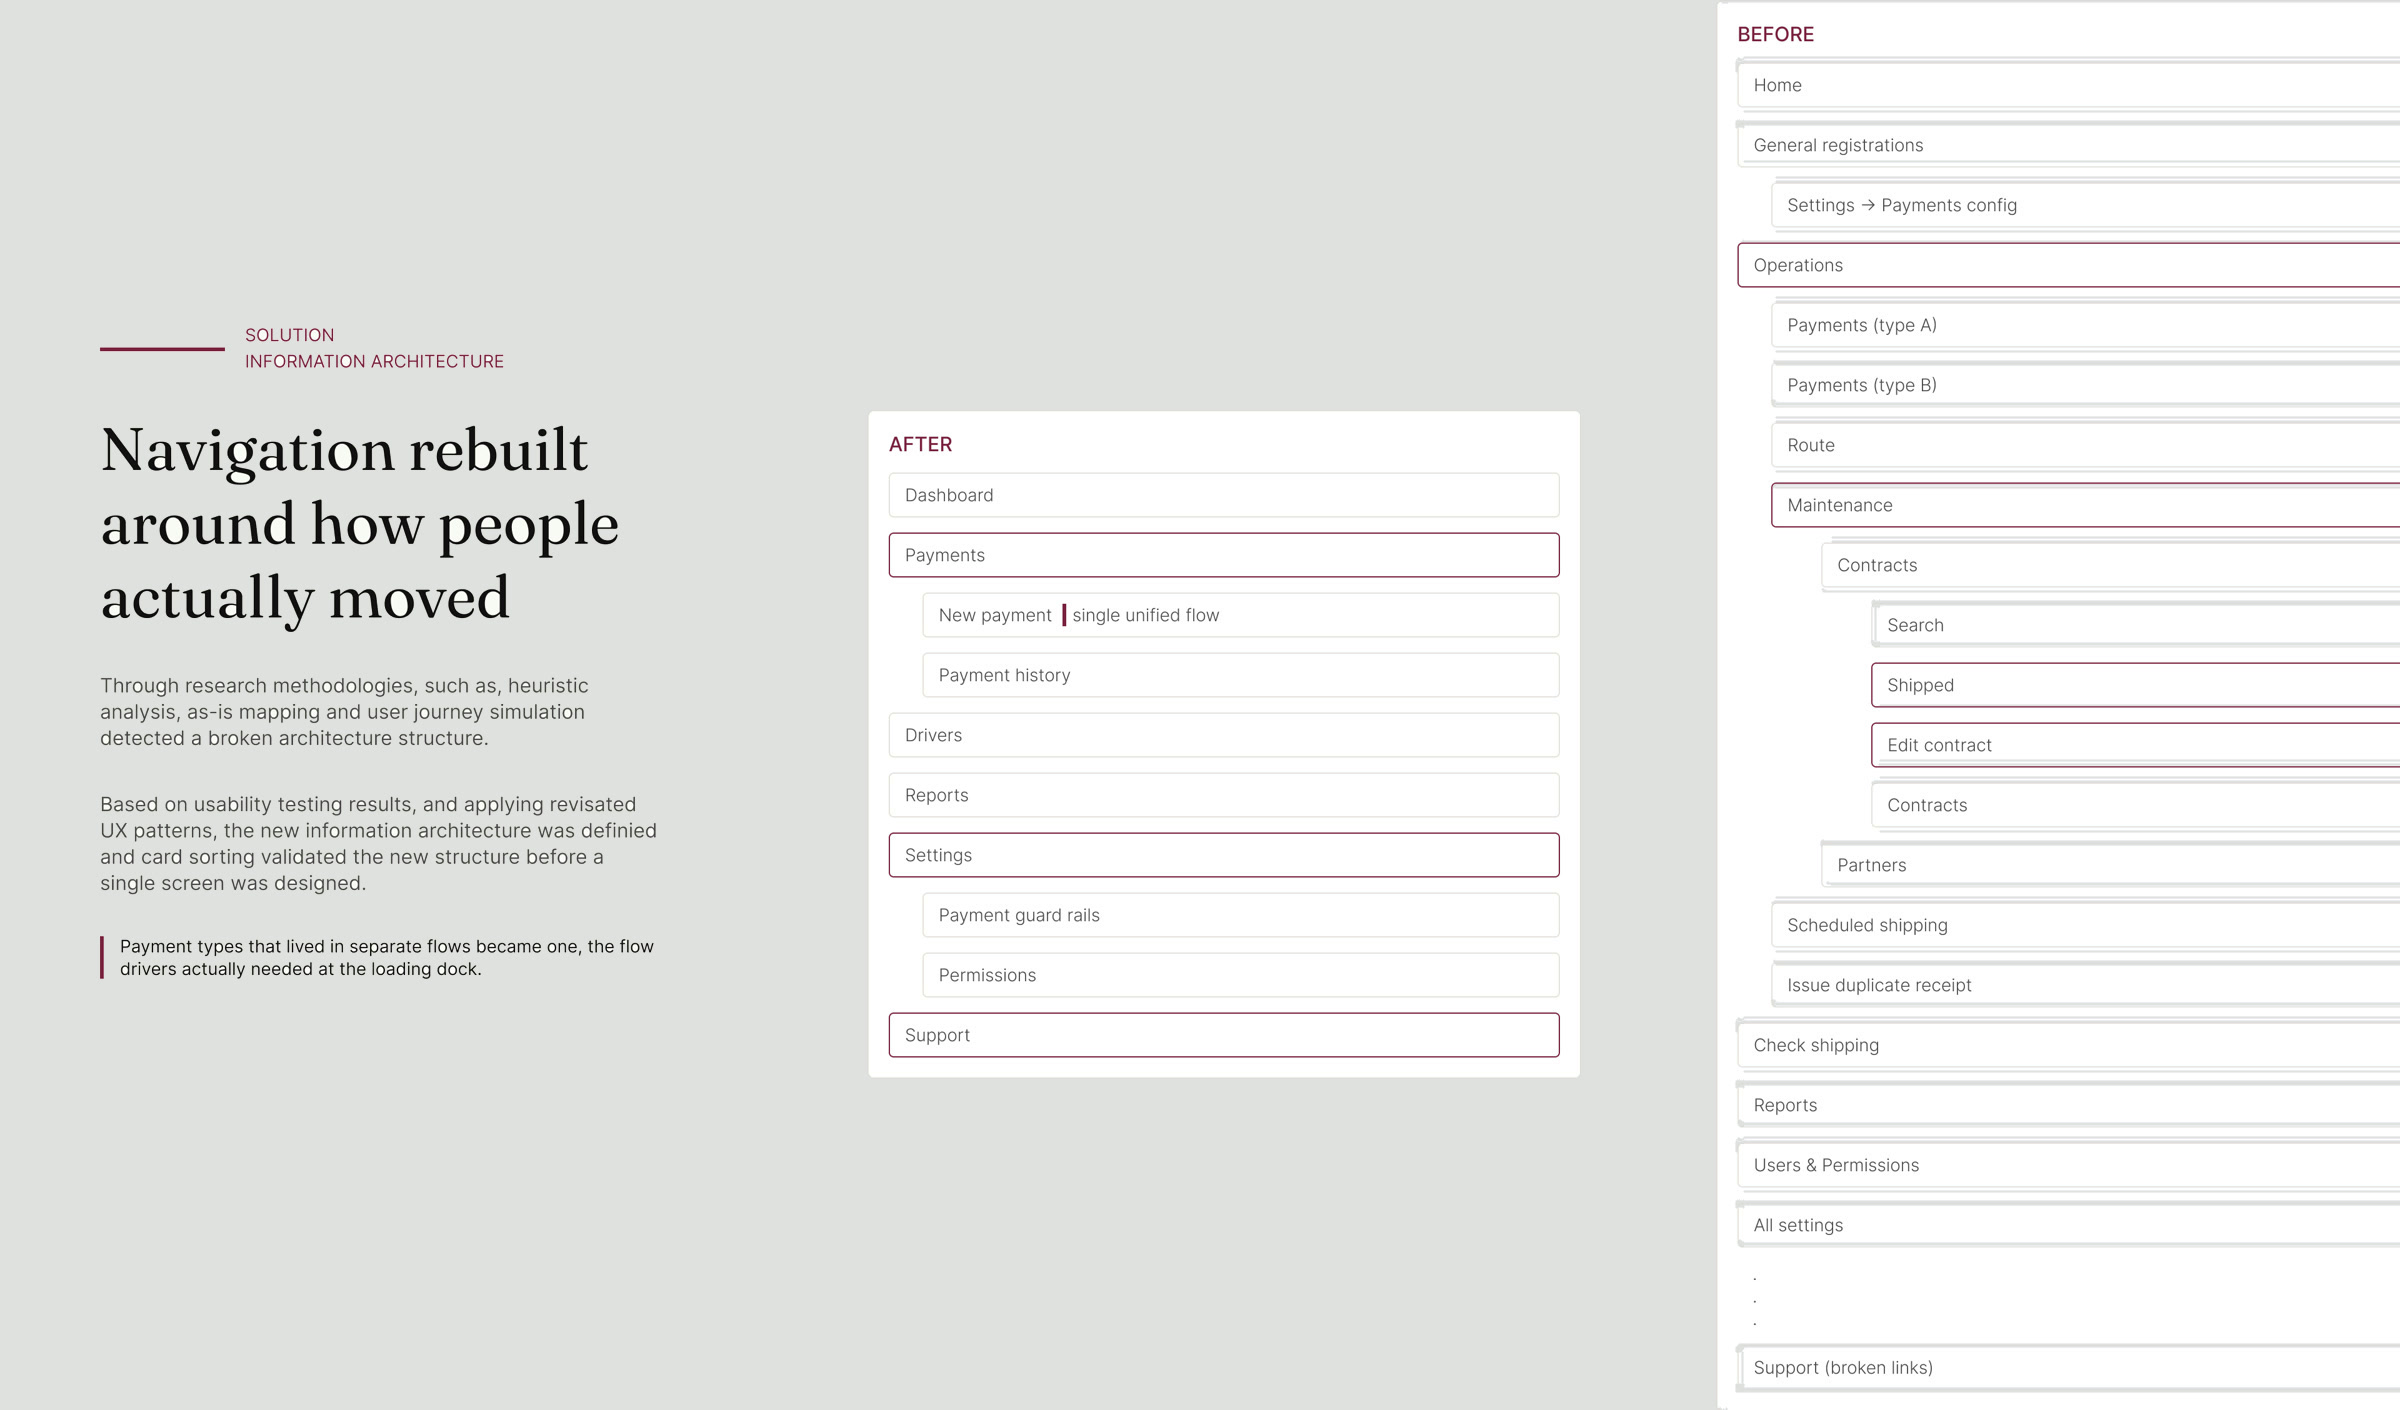
I audited every flow on the platform for each profile and benchmarked RoadCard against efrete, TruckPad, Target Bank and others: what was missing, where RoadCard lagged and where it could leap ahead. Then I proposed a new information architecture built around how users actually moved.
01Payment flow: from seven screens to three.
My first exploration mirrored the law: one screen per payment component, seven screens, 34 typed fields. Testing it on paper showed the flaw. Splitting the payment is the system's job, not the user's. In the shipped direction, the user fills one screen of freight data, the platform generates the components from the contract, and the user reviews and sends. Every value stays editable.
Payment flow redesign: seven screens and 34 typed fields reduced to three screens 02Card sorting settled the structure.
12 participants, 48 cards, open naming first and closed validation after. Five groups reached high agreement, from Payments at 92% to Integrations at 71%. Batch payments split the room 52 to 48, so I left it open and made it a usability task: 10 of 12 users looked for it inside Payments.
Card sorting results: five groups from 92% to 71% agreement, with batch payments contested 03Medium fidelity, on purpose.
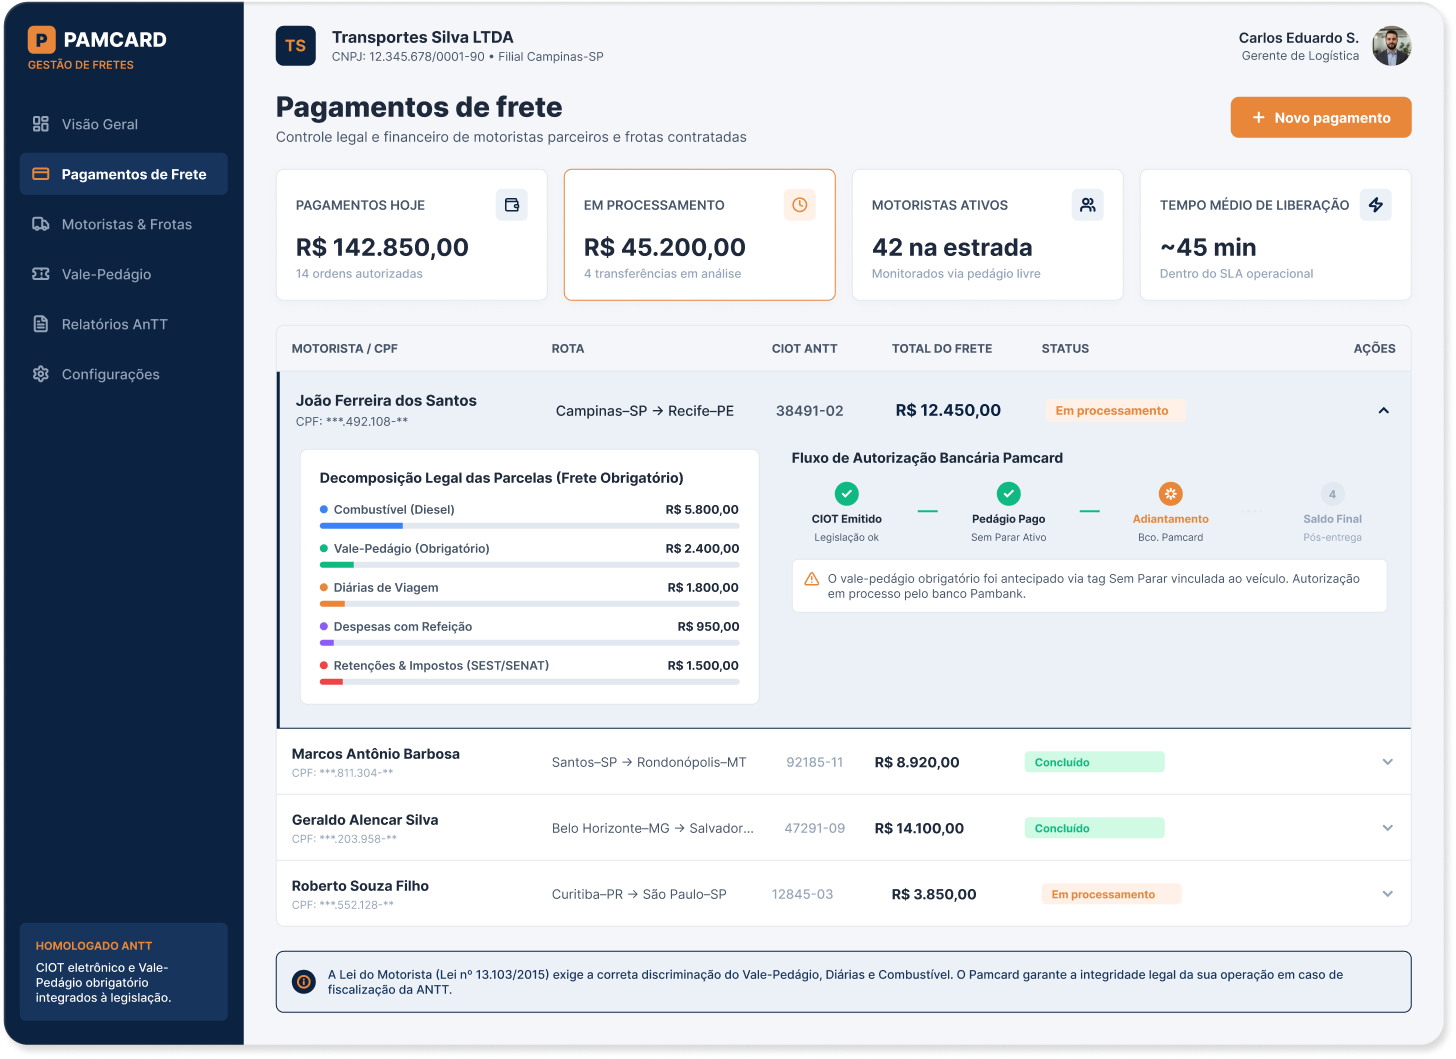
Real content, real sequence, real wording, no visual polish. Three screens carried what used to take seven, and each payment component finally showed its status: sent, processing or cleared.
04Prioritized with engineering.
Nine proposals, scored by effort, business impact and user impact, grouped into three waves. The overnight queue was the most expensive item on the board and still went first, because nothing else in the plan worked without it.
Prioritization matrix: nine proposals in three delivery waves
Usability testing
Tested against the old platform, with the original participants.
12 participants ran three tasks they do every week, first on the current platform and then on the prototype.
71% → 97%task completion
8m40s → 3m10sto issue a freight payment
2.4 → 0.4errors per participant
34 → 12steps in the flow
3.8 → 6.4ease of use, out of 7
The sessions also estimated the migration cost for long-time users, which shaped the rollout: people with years of workarounds needed the new flow to feel familiar, not only faster.
Final screens
The visual layer, on a structure that had already been tested.
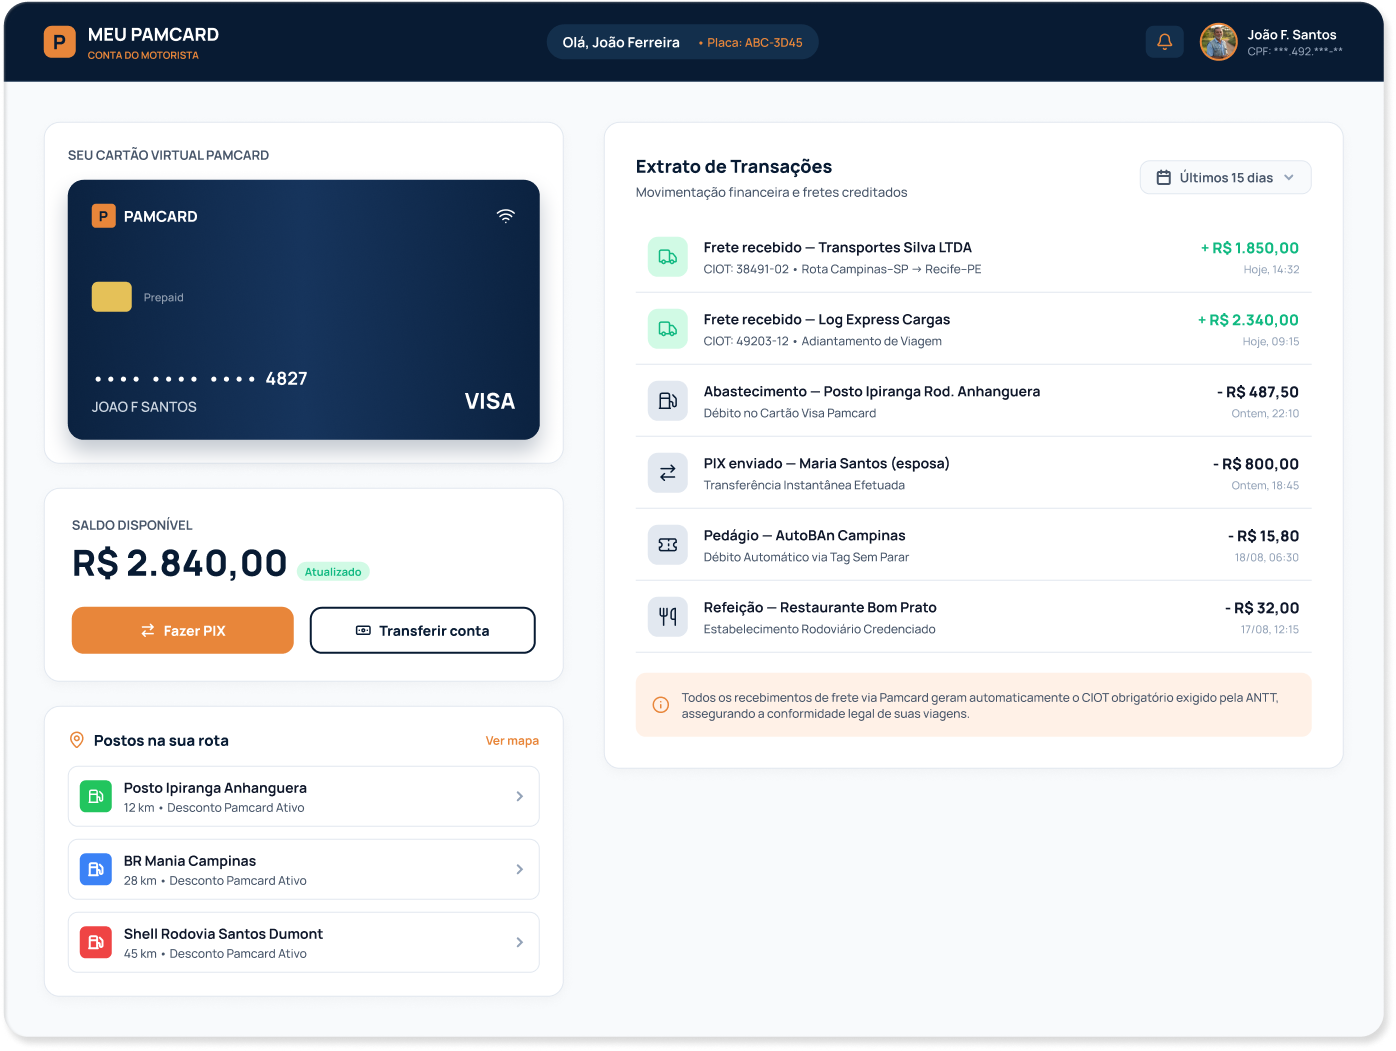
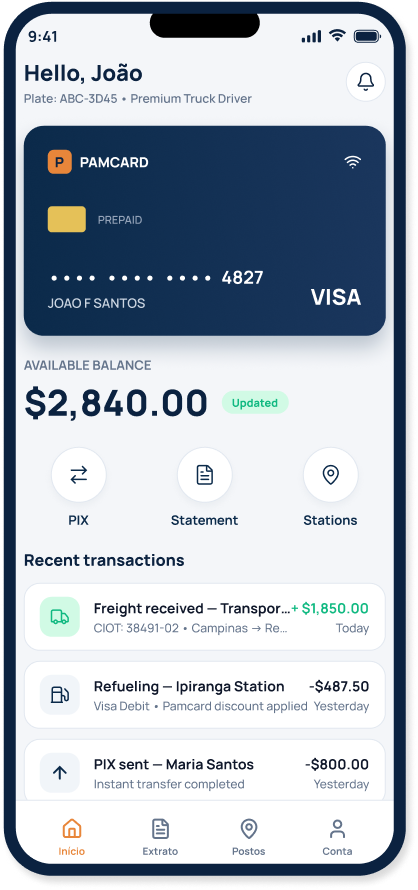
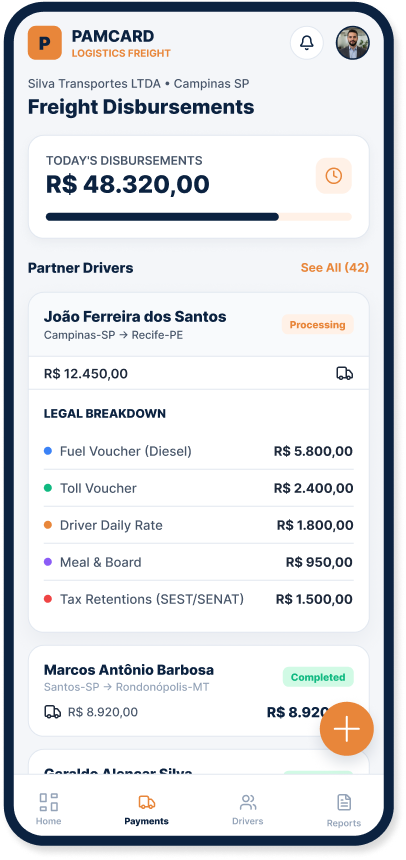
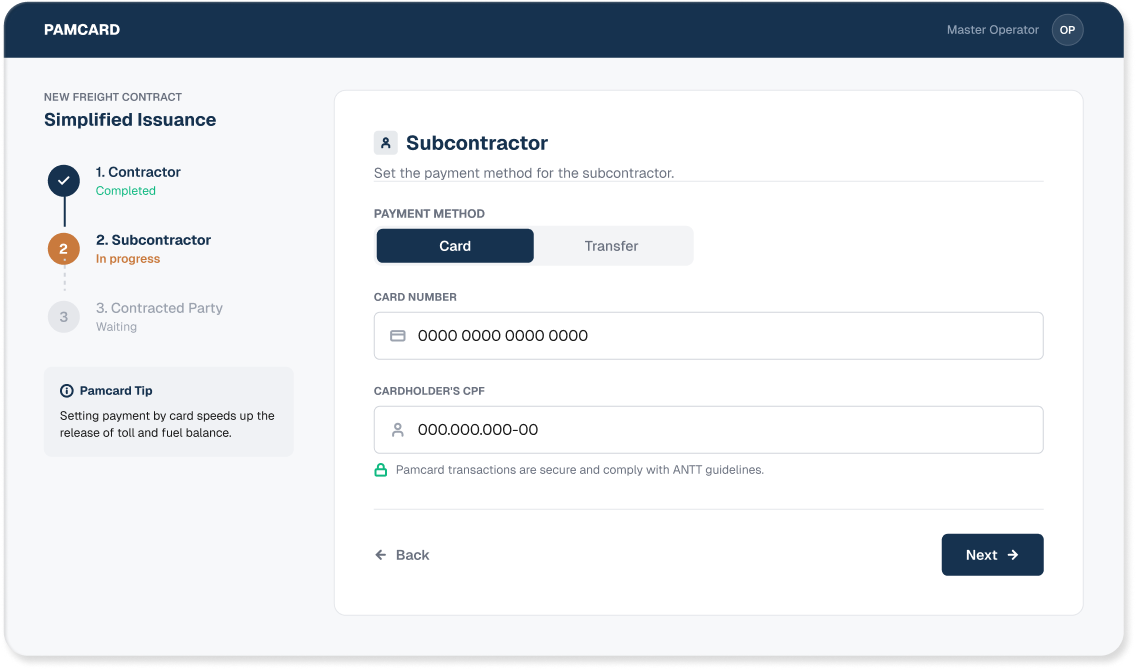
These screens show states the old platform never had: a payment processing, a payment cleared, a component corrected after sending. RoadCard's team took this set into development.
Impact
A function the company never had in ten years.
25+user interviews, where the client had done none
10h → ~1hpayment delay, after RoadCard's fix
1stinternal product and design team
Research
Found the delay no internal metric showed, traced the chain from infrastructure to user behavior to revenue, and gave the CEO a projection of what fixing it was worth: 9 to 16% more revenue from the researched client base.
Product
RoadCard engineering cut processing to about 1 hour, the limit of their current infrastructure. The redesign proposal gave them a full UI and UX roadmap, and RoadCard took delivery in-house.
Organization
RoadCard formed its first product and design team. The research was the direct reason: the company hadn't seen the value of continuous product work until it saw what structured research uncovered.
How the work was built
Methods, in order.
| Phase | Method |
|---|---|
| Foundation | Desk research: freight regulation, industry vocabulary, operations |
| Discovery | Internal stakeholder interviews and client taxonomy |
| Discovery | User profile mapping workshop |
| Discovery | Semi-structured interviews, 25+ participants, iterative sample |
| Discovery | Guided navigation sessions: observation in the user's own workflow |
| Validation | Journey maps with satisfaction and frustration scores, NPS |
| Solution | Full platform audit and competitive benchmark |
| Solution | Card sorting, medium fidelity prototyping |
| Solution | Prioritization matrix workshop with engineering |
| Validation | Task-based usability testing with original participants |