Context
Two plants. One person responsible for the quality of everything.
ADATA Electronics Brazil is the Brazilian arm of one of the world's largest makers of DRAM modules, SSDs and flash storage, with a fabrication plant in São Paulo state and an assembly plant in Manaus. The quality of everything that left both plants was one person's responsibility.
The problem
A single point of failure, five years in the making.
Every month, the quality manager downloaded four spreadsheets from the MES, keyed them into a fifth one full of formulas built over years, cross-referenced volumes, defects and yield by product, process and client, then screenshotted the results into PowerPoint. Clients like Dell needed their own reports on top.
It took 10 to 15 days and couldn't start until the MES data was available. He hadn't taken a vacation in five years. He wasn't exaggerating.
If a line made defective products for three weeks, nobody knew until the monthly report.
Research
To do the research, I had to be there.
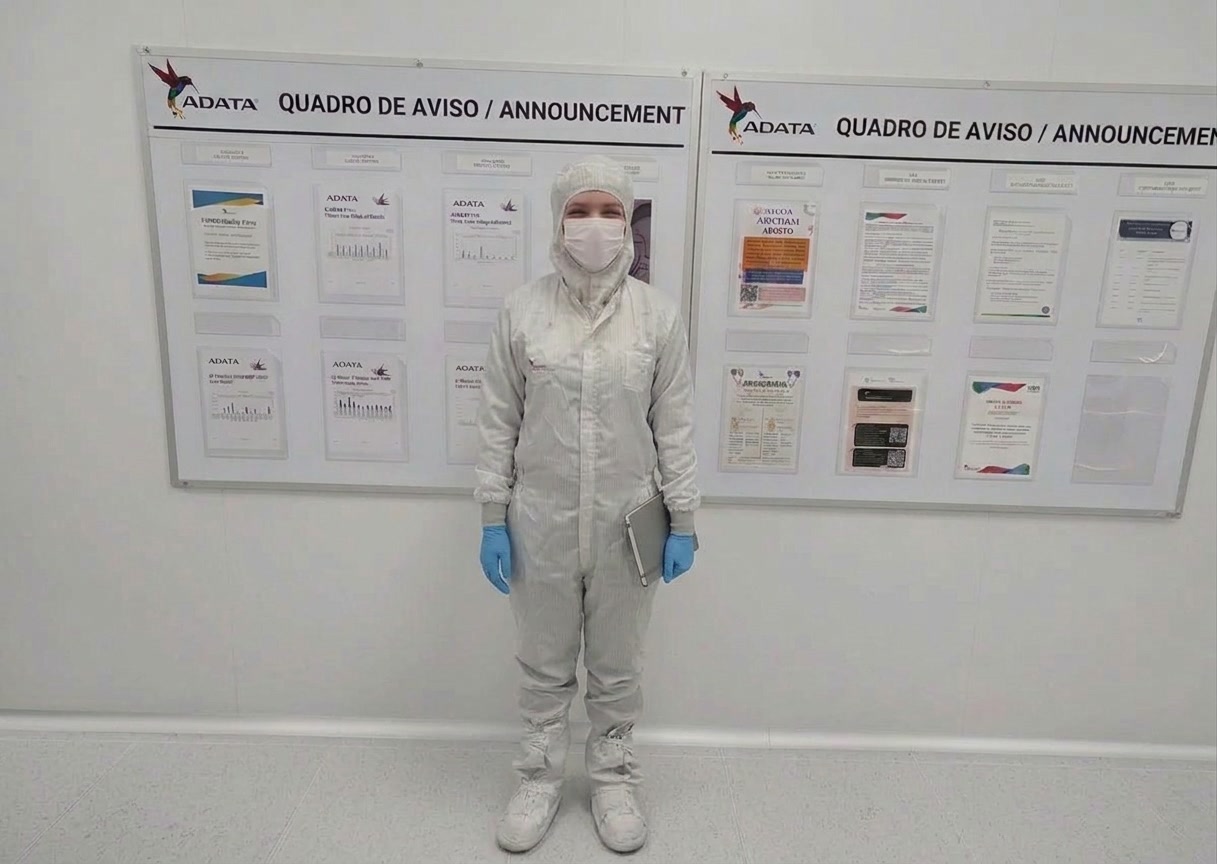
ADATA works under strict information security rules. No data could leave the premises: no email, no USB, no photos of screens, no recordings, no cloud. The system itself would run only on ADATA's internal network.
So I went on site, sometimes three times a week, in sessions of up to six hours. I sat next to the quality manager, watched him work, asked questions in real time and took notes on paper. The constraint became an advantage: direct access to the work as it actually happened.
First discovery
Before designing anything, we wrote down what already existed.
The quality manager's knowledge existed nowhere else: no process documents, no written calculation rules, no training material. If he left, ADATA would lose a knowledge system built over a decade. Our first deliverable was a complete as-is map of his process.
Building it together changed how he saw his own work. Hidden dependencies surfaced, redundancies showed, and steps done out of habit turned out to be unnecessary. Documentation became a discovery tool, for both of us.
Solution
Seven modules, each one answering a research finding.
The brief asked us to solve a data problem. Research produced seven functional areas, all running inside ADATA's own network, with no cloud dependency.
01MES integration
Automated queries replaced the spreadsheet downloads, with retries and graceful handling of downtime. New product IDs, client codes or process names were flagged for the quality manager to catalog before they entered any calculation.
System architecture: seven modules, with MES integration highlighted 02Configuration
Not a settings page. A digital twin of the factory's logic: production areas, processes, calculation rules per machine, alert thresholds, part numbers, Active Directory users and report lists. It wasn't in the brief. It came from research, and getting it right took months of sessions with the quality manager.
03Report generation
Pick a period, click generate. Reports by product, process and client, flagging what was below threshold and what was trending toward failure, with alerts before the failure happened. Moving from reactive to predictive cut machine downtime from 4 to 8 hours to 20 to 30 minutes.
04Engineer workflow
A second user type emerged: production engineers. The quality manager assigns a defect, the engineer inspects it on the floor with a tablet, records root cause and corrective action, and the manager approves. Three roles: Quality Manager, Engineer and a read-only Director view.
05Distribution and export
Approved reports go out automatically: email to configured lists, PDF for the archive, and client-specific reports such as Dell's. Internal domains only, with all traffic inside the corporate network.
System architecture with distribution and export highlighted 06Real-time dashboards and TV Mode
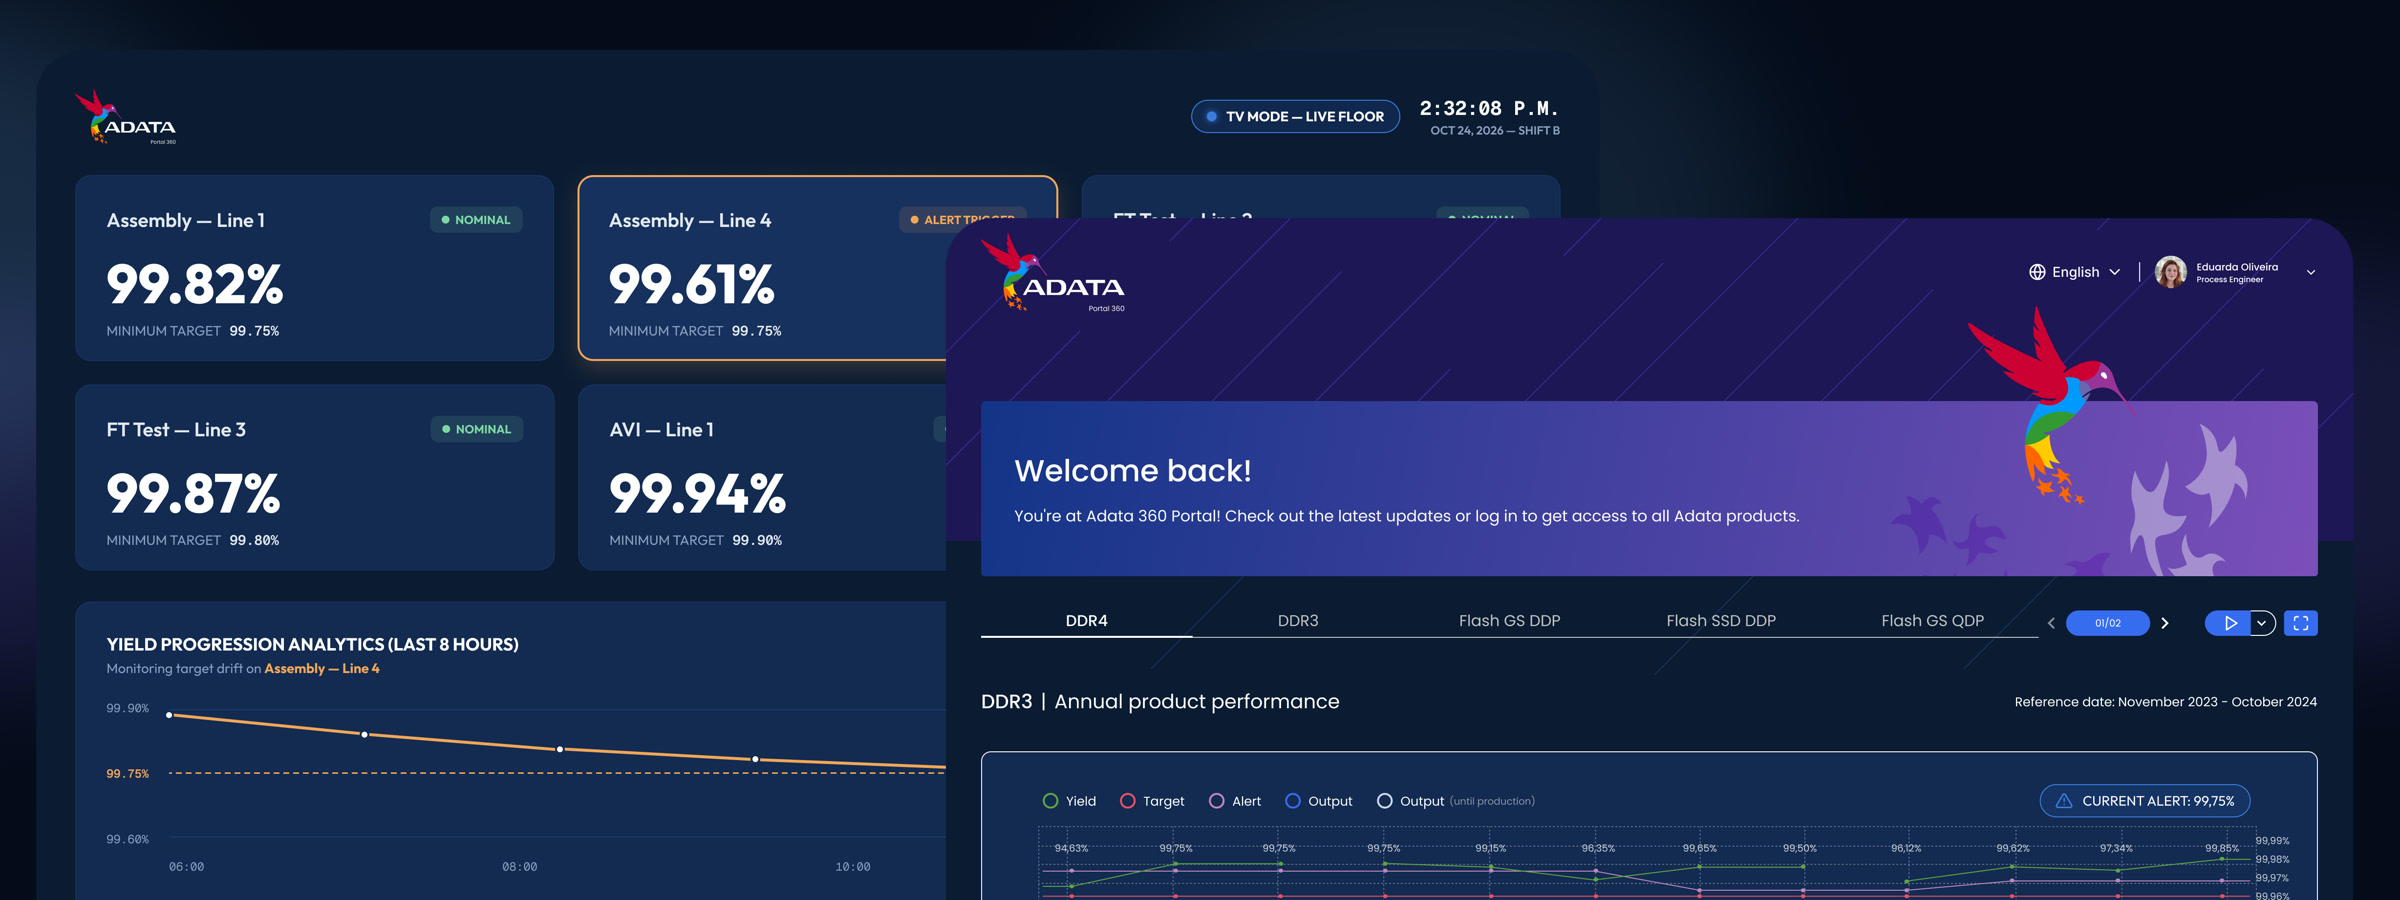
The same data fed live dashboards. TV Mode put real-time performance on large screens on the production floor, so engineers and operators could see the product they were making without asking anyone or waiting a month.
07Process documentation library
Calculation logic, standards and process definitions, written down for the first time. If the quality manager went on vacation, a colleague could look it up.
System architecture with the documentation library highlighted
Design system
100+ components, built for the whole ecosystem.
As more ADATA projects lined up, I started and led a design system: first in Chakra UI, with over 100 components across every module. About 18 months in, after weighing scalability and maintenance with engineering, we migrated to Shadcn/ui. Every component was built to scale to future products without redesign.
Validation
The system found errors in the manual reports.
Before delivery, we imported five years of production history and had the system regenerate five years of monthly, semiannual and annual reports. Then we compared them line by line with the reports built by hand.
The system found mistakes: miscalculated products, mistyped entries, defects attributed to the wrong lot. They had sat in compliance records for years. The manual process, for all the expertise behind it, had collected errors over time. The system hadn't.
Impact
A report that took 15 days now takes minutes.
Operations
Quality reports went from 10 to 15 days a month to minutes. The quality manager moved from the reporting loop to strategic and cross-plant work, and his process now lives in the system.
Quality
Downtime per defect event fell from 4 to 8 hours to 20 to 30 minutes. Calculation errors were eliminated, confirmed by the five year check, and defective lots are caught before shipping.
Strategy
TV Mode was presented at ADATA global meetings and in Taiwan as a candidate global model. The project opened 17 more engagements between ADATA and Venturus.
How the work was built
Methods, in order.
| Phase | Method |
|---|---|
| Discovery | On-site contextual inquiry, sessions up to 6 hours |
| Discovery | Semi-structured stakeholder interviews, three times a week |
| Discovery | Task analysis and as-is service blueprint |
| Discovery | Friction analysis |
| Design | Participatory design of the configuration module |
| Design | Information architecture across 7 modules |
| Validation | Iterative usability testing at the end of each sprint |
| Validation | Five year historical data check against manual reports |
| System | Design system, 100+ components, Chakra UI to Shadcn/ui |