The brief
No method. No format. A blank page.
Understand what is being developed with AI. Identify R&D and product development opportunities that Venturus could pursue.
The full brief
No method was specified and no deliverable defined. I was brought in to work with the internal product team while staying on an active client project.
The fastest way to miss what's actually there is to see only what you expect to find.
First insight
AI is not a product category.
I start every project by emptying my assumptions. For weeks I read scientific literature, industry publications, EU regulatory proposals, product announcements and developer forums.
The first real finding was about method. AI isn't a market you benchmark by listing competitors and features. It's a field of knowledge. A standard benchmark would be too narrow and too shallow at once. The right question was: what does this field look like, where is it moving, and where in it can a company like Venturus build?
Research design
Three tracks, run in parallel.
01Technology map
A structured glossary of AI fields, from generative AI and LLMs to RAG, NLP, computer vision, reinforcement learning and edge AI. Each term marked a possible direction, and over time the glossary became a map of which fields were rising, steady or fading.
02Competitive intelligence
Competitor research papers, LinkedIn activity, client materials and public demos, plus hands-on tests where access allowed. Competitors were building support automation, product search, data classification and document processing. Mapping that onto the technology map showed where activity clustered and where the gaps were.
03Barriers
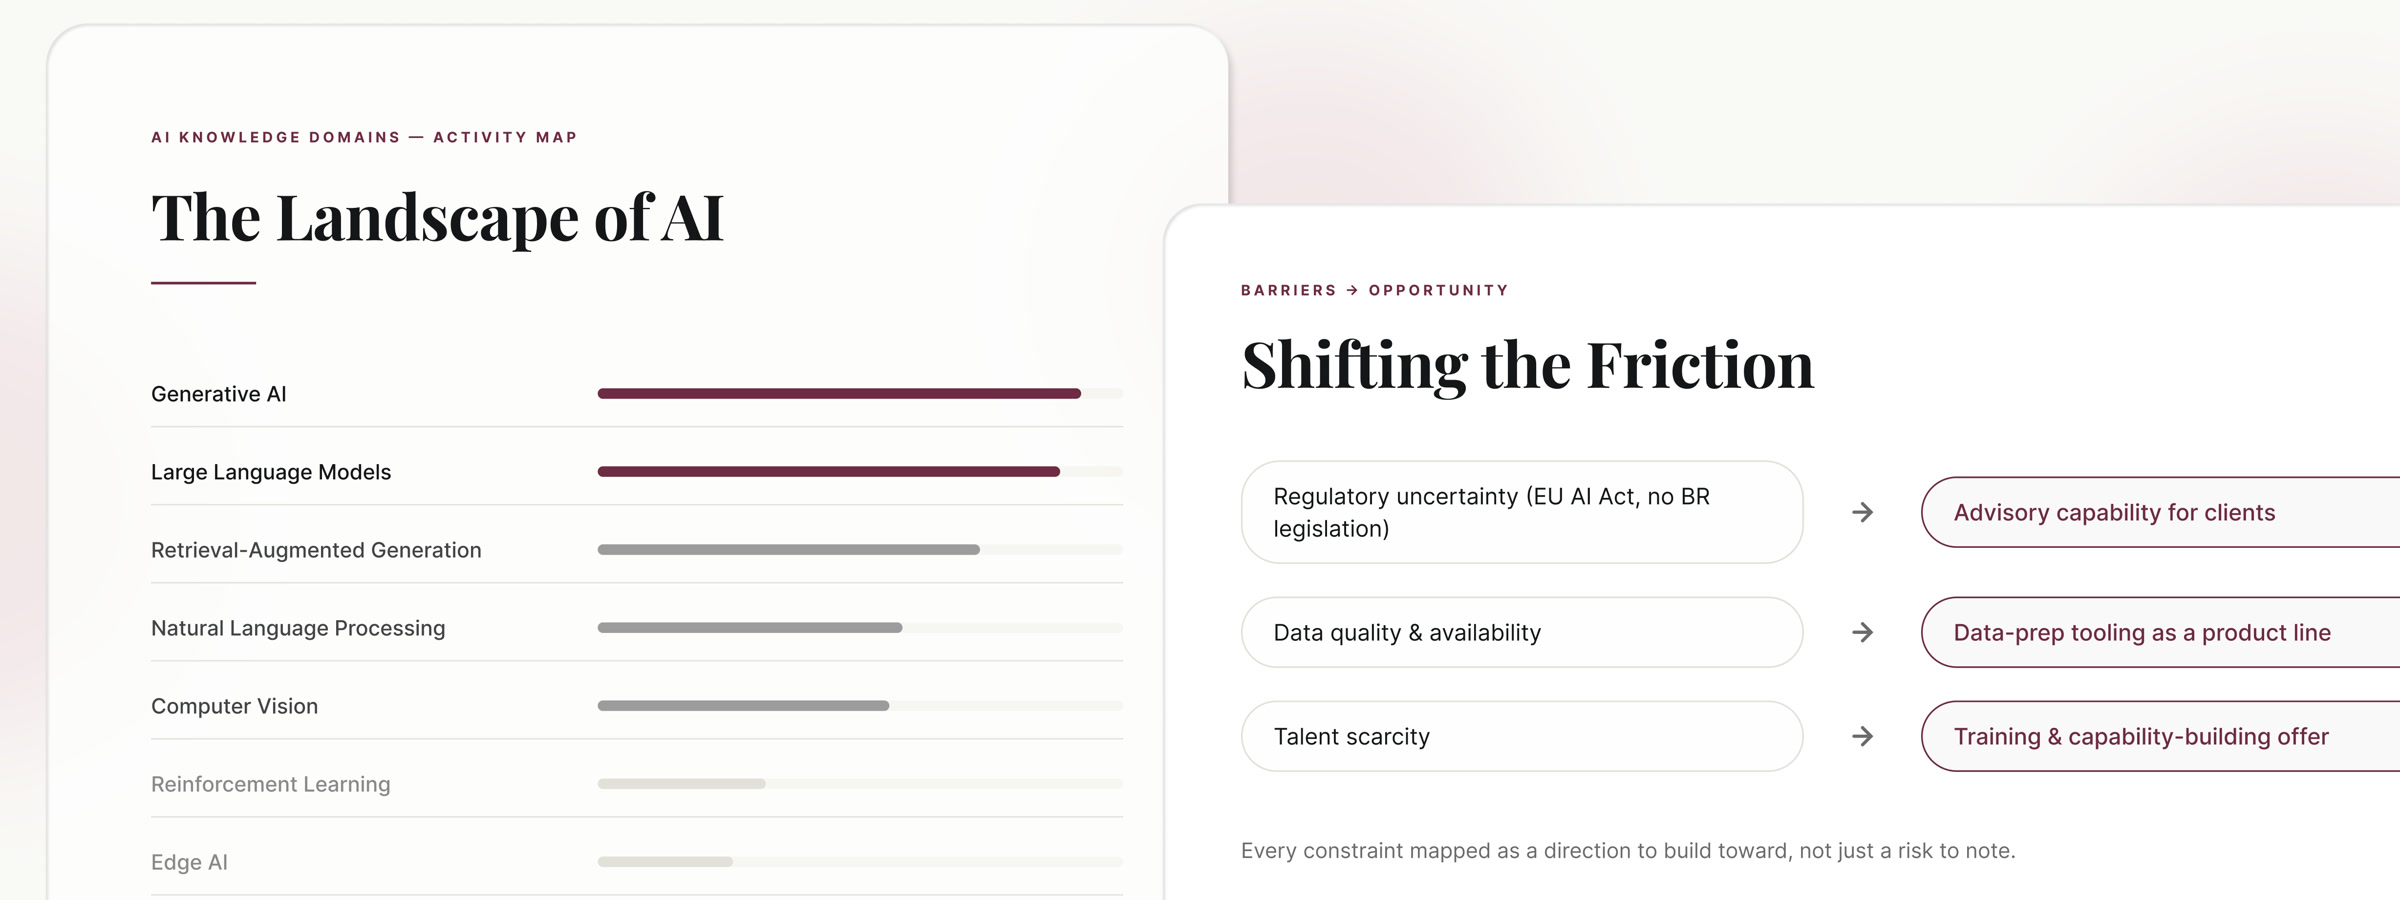
Hardware gaps, data quality, regulatory uncertainty (the EU AI Act was early and Brazil had no AI law), talent shortage and unclear intellectual property. Each barrier was a place Venturus could build capability, in products or in advising clients.
The meta-problem
A static report would start aging the day it was finished.
By week five the research was producing real insight, but AI in 2024 changed weekly. Six weeks of work would be history in three months. The format had to match the subject.
Research is only valuable if it can drive decisions, and decisions require data you can trust is current. A report that ages is a liability, not an asset.
The answer wasn't a document. It was a tool.
The deliverable
The Technology Thermometer.
A live dashboard in Airtable, chosen because the whole team already used it, so adoption cost nothing. Anyone could update it and anyone could query it. Three views, meant to be read together, because the insight lived where they overlapped.
01Activity map
AI fields with frequency metrics from literature scanning: how often each appeared in recent papers, research outputs and product news.
Technology activity map: frequency by AI field 02Competitive landscape
Competitors mapped against the fields they were active in. Crossed with the activity map, it showed crowded fields to enter with care and busy fields with no competitor yet.
Competitive landscape mapped by AI field 03Barriers and opportunities
Each constraint linked to a possible product or research response. A field busy in literature, thin in competitor portfolios and blocked by a barrier Venturus could solve: that was where to invest.
Barriers mapped to opportunities
Impact
Six weeks of research became a product line.
Immediate
The product team adopted the Thermometer for R&D decisions, several product ideas entered the pipeline, and the documentation became the company's official method template.
Organization
About 45 people adopted the method: the product team (about 15) and the design consulting team (about 30). Other business areas built their own dashboards with the same structure.
Commercial
Venturus turned the method and the Thermometer into a service and sells it to clients who need technology intelligence in their own fields.
How the work was built
Methods, in order.
| Phase | Method |
|---|---|
| Foundation | Systematic desk research: literature, publications, regulation |
| Foundation | Horizon scanning for emerging areas and signals |
| Competitive | Competitive intelligence: published outputs, product trials, demos |
| Competitive | Analogous market analysis across adjacent sectors |
| Synthesis | Knowledge domain mapping by technology area |
| Synthesis | Barrier and opportunity analysis |
| Delivery | Data visualization of activity and competition |
| Delivery | Glossary as a navigation tool |